Understand P3 metrics
P3 offers a comprehensive suite of metrics designed to provide insights such as:
- Number of requests entering the service
- Number of optimized pages
- Number of optimized requests.
- Time used by P3 to analyze and validate optimizations
- Number of failed and successful requests
These metrics collectively give you a detailed view of P3's operational efficiency, performance impact, and optimization success. These metrics enable technical teams to make informed decisions and continuously refine their web performance strategies.
Understanding Pages and Requests
Before analyzing your P3 metrics, you need to understand the difference between pages and requests.
- A page is a single URL that contains HTML.
- A request is when a user (bot or human) requests to view the page.
Consider the following scenario:
- Pages A, B, and C are optimized.
- Each page has ten users visit it.
In this case, the metrics would show three (3) pages and 30 requests.
Access P3 Metrics
These metrics offer insights into your P3 policies. To access these metrics:
- Log in to your PhotonIQ Performance Proxy dashboard.
- Click Dashboard.
- Select a time range to view metrics for:
- Last 24 Hours
- Last 7 Days
- Last 30 Days
You can view the following metrics:
Request Counts
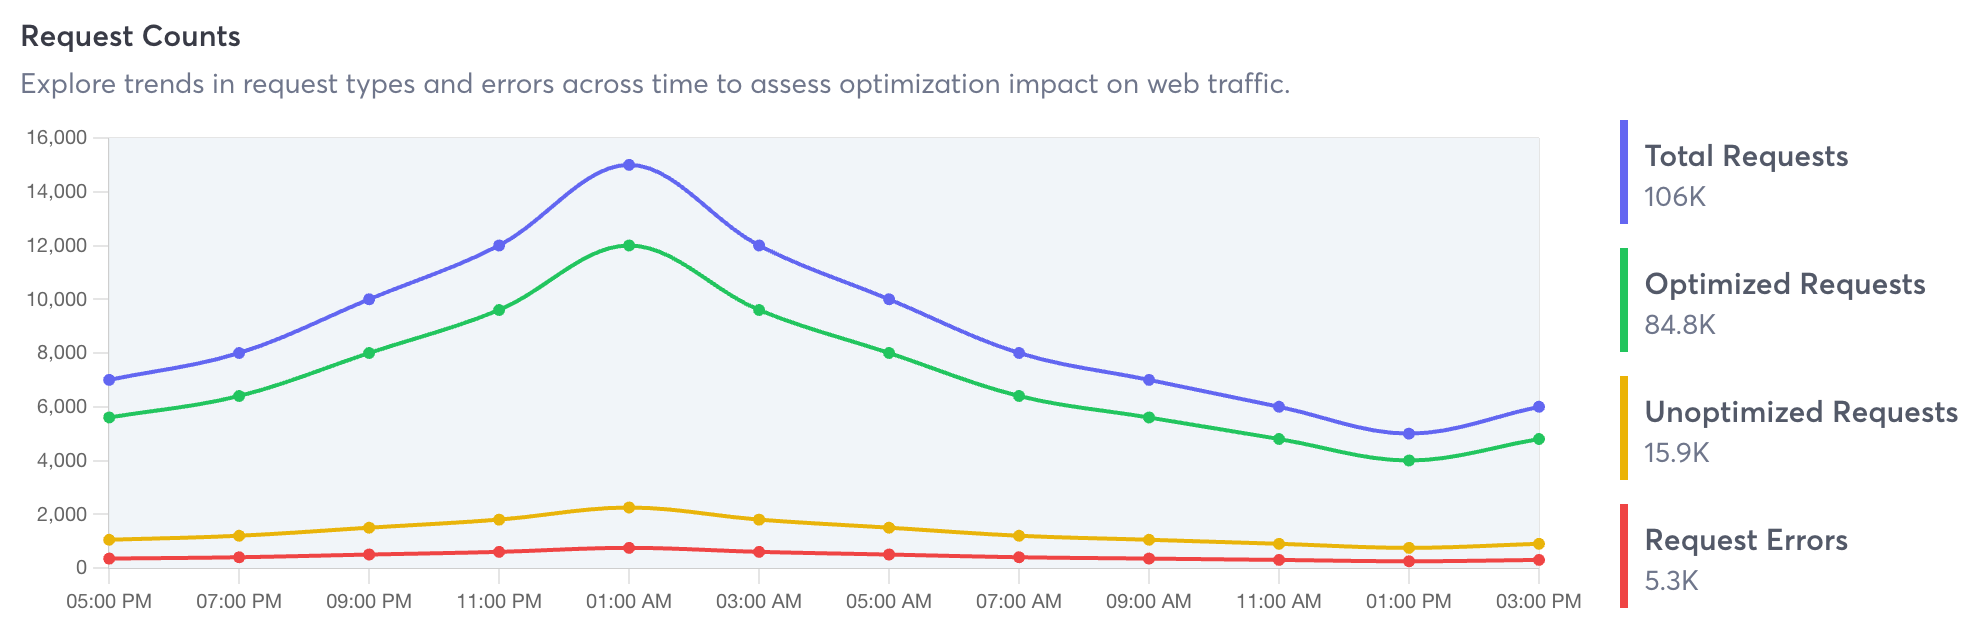
The request counts dashboard displays info on the following metrics:
- Request Count/Total Requests (1hr, 1d, 1m): This represents the total number of requests processed by P3 over the past hour, day, and month, respectively. Hover your cursor over a dot for more information.
- Request Errors Count (1hr, 1d, 1m): The number of requests resulting in errors when requesting the content from the origin over the past hour, day, and month.
- Requests Optimized Count (1hr, 1d, 1m): Counts the requests that were successfully optimized by P3 in the last hour, day, and month.
- Requests Unoptimized Count (1hr, 1d, 1m): The count of requests that were not optimized over the past hour, day, and month, providing insights into potential areas for improvement.
Requests Per Second
- Max RPS - Maximum requests per second.
- Max Error RPS - Maximum error requests per second.

Optimization Overview
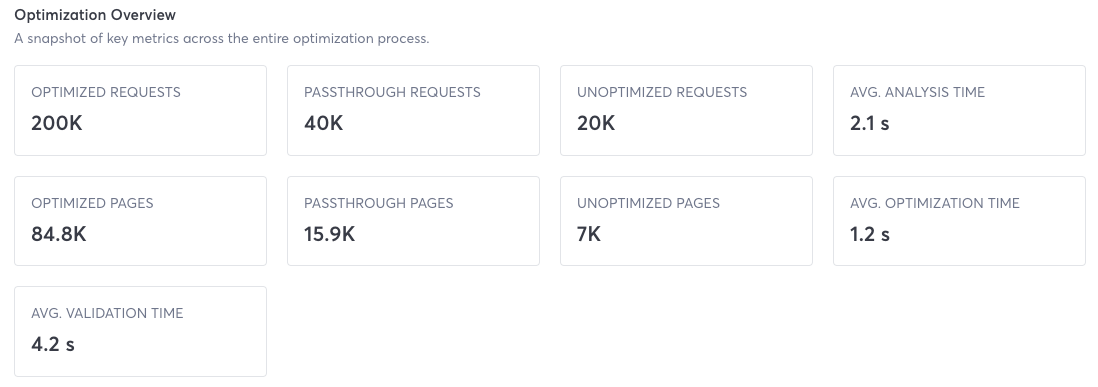
The optimization overview dashboard offers info on the following optimization metrics:
- Optimized Requests: Total pages with successful optimization, indicating the scope and impact of P3's optimization efforts.
- Passthrough Requests: The count of requests for pages not configured for P3 optimization but still pass through P3.
- Unoptimized Requests: The count of requests for pages not optimized or cannot be optimized by P3 at that time.
- Average Analysis Time (seconds): The average time taken by the Offline Analyzer to assess and formulate optimization strategies for the incoming URL which matches the configured URL pattern in policy
- Optimized Pages: The total number of pages successfully optimized by P3.
- Passthrough Pages: The number of unique pages that pass through P3 without being configured for optimization.
- Unoptimized Pages: The number of pages not optimized or cannot be optimized at the time of analysis by P3.
- Average Optimization Time (seconds): The average time taken to optimize a page. This metric helps in evaluating the efficiency of the optimization process.
- Average Validation Time (seconds): The average time spent validating the applied optimizations. This prevents the page from visually breaking and ensures the optimizations doesn't break the functionality of the page.