View Prerender Activity
You have several options for viewing Prerender activity, either aggregated or per origin.
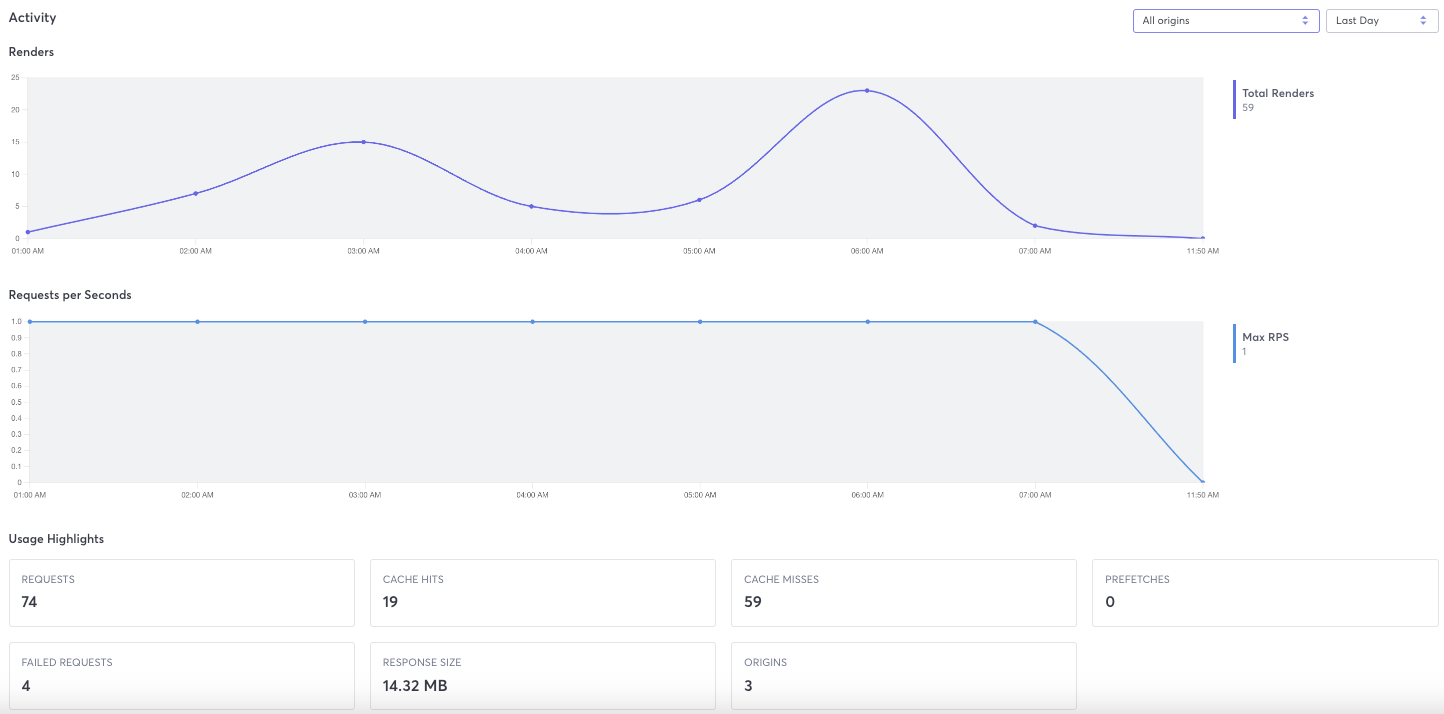
- Activity tab - You can view activity metrics for all origins or for one origin on the Activity tab in the web console. You can view metrics for the last day, the last week, or the last month.
- REST API - Macrometa provides several API calls that allow you to view metrics for all origins or for one origin. You can also sort and set any time frame that you need.
View Prerendering Activity
- Web Console
- REST API
Follow these instructions to view prerender activity in the web console.
- Log in to your Prerender dashboard.
- Click Activity.
- (Optional) Select a specific origin. Default is All origins.
- (Optional) Select a time frame. Default is Last Day.
Activity Metrics
Prerender provides the following metrics. Field names in the web console are different than those in the API responses. Refer to the API endpoint documentation for a full explanation of the API response.
- Renders - Total number of renders performed.
- Requests per Second (RPS) - Number of renders performed per second.
- Requests - Total number of page requests received.
- Cache Hits - Number of requests served from the cache.
- Cache Misses - Number of requests that were not in the cache and were dynamically rendered instead.
- Prefetches - Number of prefetched pages served.
- Failed Requests - Number of requests that were not served by rendered pages.
- Response Size - Sum of all response sizes.
- Origins - Number of origins with pages rendered.