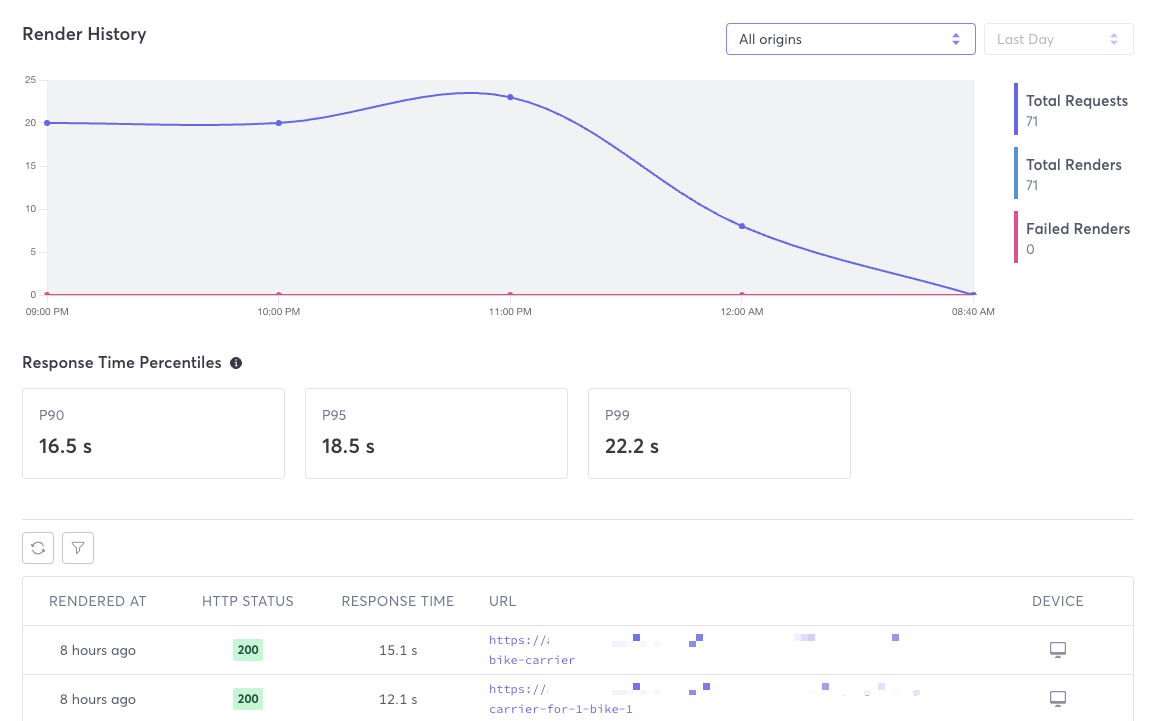
View Rendering History
You have several options for viewing Prerender render history, either aggregated or per origin.
- Render History tab - In the Render History tab in the web console, you can view render history for all origins or for a single origin. You can also filter the history view based on HTTP status.

- REST API - Macrometa provides several API calls that allow you to view render history for all origins or for one origin. You can also sort and set any time frame that you need.
View Render History
- Web Console
- REST API
Follow these instructions to view render history in the web console.
- Log in to your Prerender dashboard.
- Click Render History.
- (Optional) Select a specific origin. Default is All origins.
- (Optional) Apply filters to the list of rendered pages if you want to narrow the results.
Use our interactive API Reference to:
Render History Metrics
Prerender provides the following metrics. Field names in the web console are different than those in the API responses. Refer to the API endpoint documentation for a full explanation of the API response.
- Total Requests - Total page requests received during the selected time frame.
- Total Renders - Total renders successfully performed during the selected time frame.
- Failed Renders - Total renders that failed during the selected time frame.
- Response Time Percentiles - Response time percentiles in seconds.
- Rendered At - When the render was performed.
- HTTP Status - HTTP status code received.
- Response Time - Amount of time it took to send the response.
- URL - Rendered URL. Click the URL to view the page.
- Device - Icon indicating whether the render was for desktop or mobile.